View Investments - At A Glance
At A Glance is found on the Investments Summary
page. It shows a high-level overview of the value of the account
or consolidation selected in the Account/Consolidation
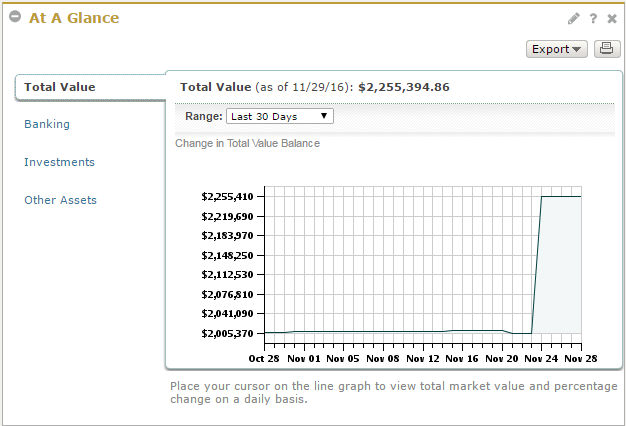
Selector. When a
is selected, At A Glance shows the "Total Value" of the consolidation
as of the previous business day, as well as the valuation information
for each within
the consolidation for the previous business day compared to the previous
month end. When an individual account is selected for viewing, At
A Glance shows the valuation of that account as of the previous business
day compared to the previous month end.
For the Consolidation, Banking, and Investments
views in At A Glance, you can select a range to view the change in total
value over the last 30 days (default), month to date, quarter to date,
previous month, previous quarter, year to date, or last 12 months. Also,
mouse over a point on the graph to view and % market value change for the date selected. For
each view, you can also see the following:
At
A Glance - Consolidation view
|
 |
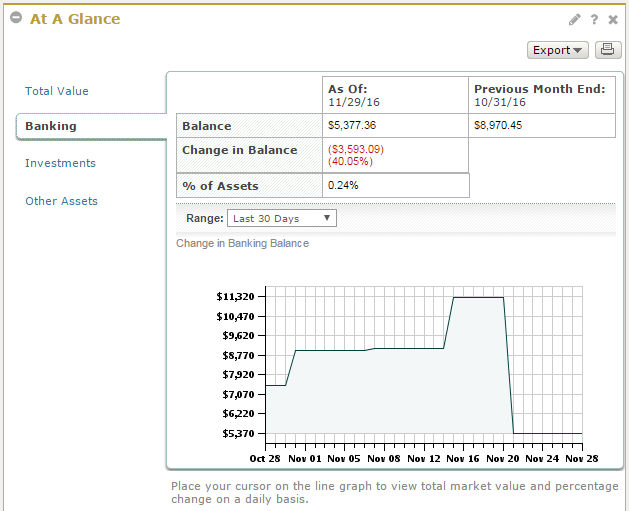
At
A Glance - Banking Account view
Total balance as of previous business
day, compared to previous month end Income received for quarter to date
and year to date % of assets |
|
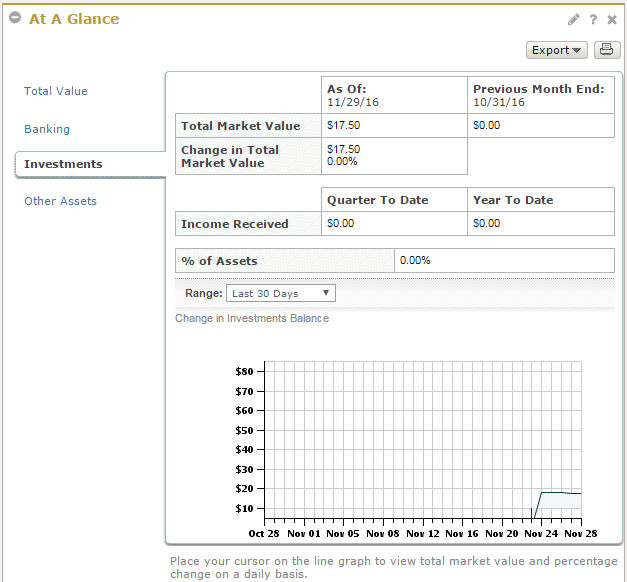
At
A Glance - Investments Account view
as of previous business day, compared to
previous month end Change in total market value Income received for quarter to date
and year to date % of assets |
|
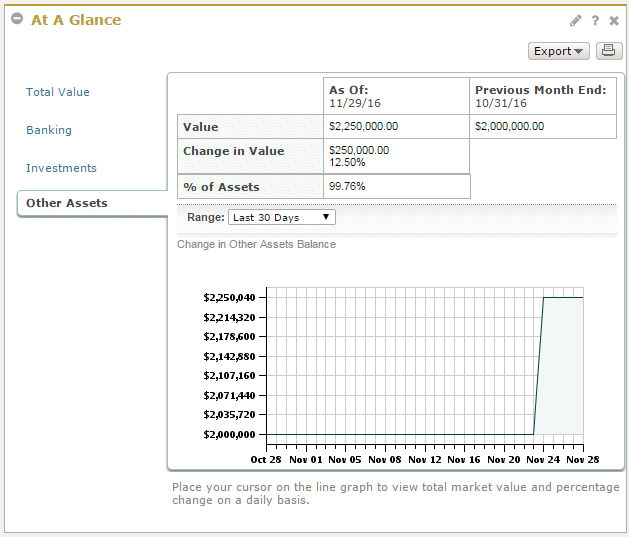
At
A Glance - Other Assets Account view
Value as of previous business day,
compared to previous month end Change in value Income received for quarter to date
and year to date % of assets
|
|
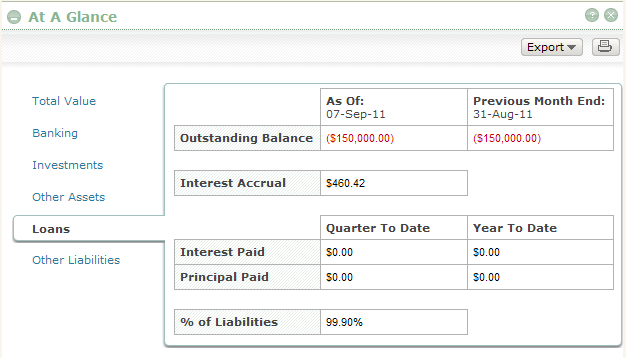
At
A Glance - Loans Account view
Outstanding balance as of previous
business day, compared to previous month end Interest accrual Interest and principal paid quarter
to date and year to date % of liabilities |
|
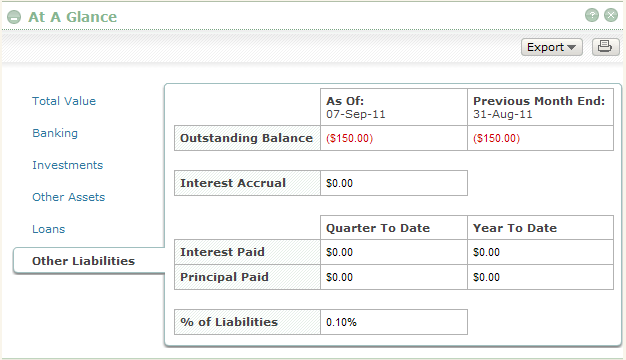
At
A Glance - Other Liabilities Account view
Outstanding balance as of previous
business day, compared to previous month end Interest and principal paid quarter
to date and year to date % of liabilities |
|
Track the Change in Value Over a Specified Period of Time
Note: This
is only relevant for the Consolidation, Cash, and Investments views.
Navigate to Investments
--> Overview.
Within the Account/Consolidation
Selector, select an account or consolidation.
In the Range
field within At A Glance, select a value from the drop-down list.
The graph will refresh to show the data for the selected value.
Mouse over a point on the graph to view
total market value and % change information for a specific date.
Related FAQs
How do I select which account/consolidation
I want to view?
Related Topics
See how the assets within your account or
consolidation are allocated. See View
Holdings Overview.
You can also view detailed asset level information
for your account or consolidation. See View
Holdings Detail.
If you want to see a list of all the transactions
that have occurred within your investment and other asset accounts,
go to the Investment Activity page. See View
Investment Activity.
For a quick and easy way to see key realized
and unrealized gain/loss activity, including tax lots, go to the Gain
& Loss page. See View
Gain & Loss.
You can also see the total market value
for each individual account in your consolidation within the Net Worth
Summary or Net Worth Details. See View
Net Worth Summary and View
Net Worth Details.
