Whereas Holdings Overview displays the market value of holdings for each asset class or sector, Holdings displays more characteristics (e.g., quantity, unrealized gain/loss, tax cost, etc.) for each holding, as well as allows you to customize your own views. The Holdings detail is just relevant for your Investment and/or Other Assets accounts, like Holdings Overview.
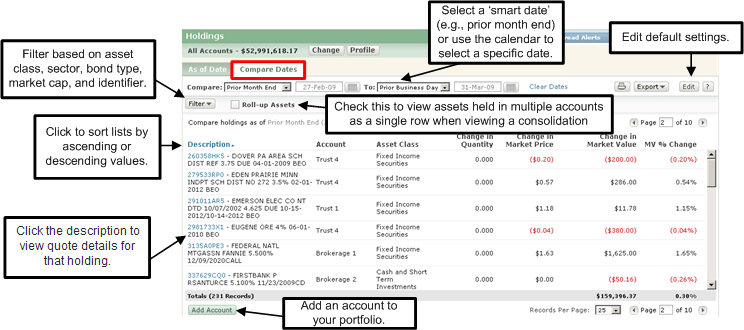
Note: When viewing a consolidation in Holdings, when 'Roll-up Assets' is selected then assets held in multiple accounts will display as a single row. In this case, the 'Account' column will not be displayed.
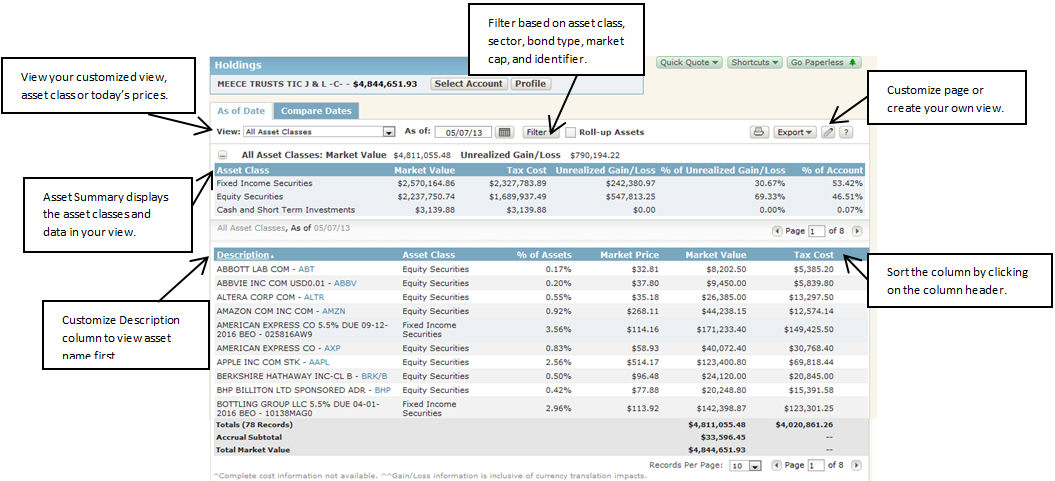
As Of Date
In the As of Date tab, you can view up to seven columns of data for your holdings, as of a specific date. By default, the date will be set to the previous business day, unless you change it. Further, you can filter your list of holdings based on certain asset classes, equity sector, bond type, market cap and identifier. Filter results are based on the asset class view selected. Not every asset class is available in the filter. However, when viewing 'All Asset Classes' in the main view, you can filter by each individual asset class in the Asset Class filter. Summary views for all asset classes can also be seen in the Holdings Overview. For the % of Assets column, the values are based on the filter criteria. For example, if you filter by Mid Cap, then the % of Assets values listed are in relation to Mid Cap assets.
You can also customize your own view by selecting an asset class and choosing which columns to display. The As of Date tab provides totals for market value, tax cost, and unrealized gain/loss; for market value, the total is provided both with and without accruals (individual market values listed are not inclusive of accruals).
An Asset Summary table is available on the As of Date tab that allows you to view the asset classes in the selected View, Date, Filter and Account/Consolidation selection. By default, the table is collapsed below the filter options that sums the Market Value and Unrealized Gain/Loss. When expanded by clicking on the + button, the table expands to display your asset classes with Market Value, Tax Cost, Unrealized Gain/Loss, % Unrealized Gain/Loss and % of Account. This table is dynamic based on the filter selections you can make on the data below.
Note: The 'Today's Prices' view allows you to view the current day's market value, market price, and change from previous day for a holding. Values will be shown in US dollars and percentages. The 'Today's Prices' view can also be selected as the default view.
Compare Dates
In the Compare Dates tab, you can compare data for your holdings between two dates. There are two options for selecting dates - either use the 'smart dates' (e.g., prior month end, prior quarter end, etc.) or select a specific date (or you can even do a combination of the two). You can also filter by the same options in the As Of Date tab. The columns in Compare Dates are fixed, meaning you cannot customize them. They include Description, Asset Class, Change in Quantity, Change in Market Price, Change in Market Value, and Market Value % Change. The Compare Dates tab provides a total for Change in Market Value and Market Value % Change.
To see the Quantity, Market Price, and Market Value for each of the dates being compared, simply point your mouse on the numbers listed in the Change in Quantity, Change in Market Price, or Change in Market Value columns.
What does rolling up assets do?
Where can I get news for a stock?What is the NTSI Brokerage Net credit/Debit Cash asset?
For the 'As of Date' tab, you can select to see different columns displayed for each asset class you view, as well as set the default column to sort. See Create Holdings Detail Custom Views.
For both the 'As of Date' and 'Compare Dates' tabs, you can set preferences such as dates, asset class view, and whether or not to roll-up assets. See Choose Holdings Detail Default Settings.
See how the assets within your account or consolidation are allocated. See View Holdings Overview.
View high-level valuation information for your consolidations and/or accounts. See View Investments Summary - At A Glance.
If you want to see a list of all the transactions that have occurred within your investment and other asset accounts, go to the Investments Activity page. See View Investment Activity.
For a quick and easy way to see key realized and unrealized gain/loss activity, including tax lots, go to the Gain & Loss page. See View Gain & Loss.
You can navigate contextually to view Holdings for a specific investments or other assets account via the Action Menu in Net Worth Summary or Net Worth Details.
![]()